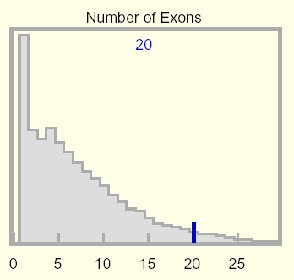
This histogram displays a genome-wide statistical distribution based on the number of coding exons in the kgProtMap table. The number of coding exons in the selected protein is displayed at the top of the graph, and a dark blue vertical line highlights this count relative to the genome-wide distribution.
To view a linear depiction of the position and layout of the exons within the gene and their correspondence to the protein's amino acid sequence, see the Exons track.
The exon positions displayed in this track were derived from the kgProtMap table (an alignment of protein, mRNA, and genome data).
Within an orthologous gene family, the exon number, exon locations, length, and coding phase (how a codon is split between consecutive exons) are usually conserved from mammal to fugu, but not to nematode or fruit fly. Paralogous gene families do not necessarily conserve any of these attributes when gene duplications are very old, as is the case with the 17 members of the mammalian sulfatase family.
The genome-wide statistical distribution is based on protein data from the kgProtMap table (an alignment of protein, mRNA, and genome data). These data are somewhat distorted because a small number of alternatively spliced genes are counted more than once, and the first and last exons of many predicted genes are incomplete.
Long introns give rise to systematic errors in the tables, because predicted genes are often unwittingly split into two or more pieces. This skews the exon number distribution toward lower counts. In some cases, purely UTR exons are inappropriately included. While further work will improve and add many gene models, the overall affect on statistics may be slight.
Reference mRNAs do not always align fully anywhere in the genome for a variety of reasons as determined by Blat. It is worth distinguishing gaps in the genomic sequence that may disappear in later assemblies and indel polymorphisms in the mRNA relative to the genome. For example, genomic PRNP is 24 bp shorter than 98% of mRNAs from random subjects. Blat is not reliably capable of finding short exons in long introns, the shortest known being a two-codon exon. These latter problems do not go away with finished genome, although many short exons could be successfully force-fit by a second, tuned Blat pass, given the constrained target intron and phase consistency requirements.
On the Proteome Browser display, the amino acid sequence is derived from its experimental evidence, the mRNA, whereas the exon track comes from the genomic alignment. When a piece of the mRNA cannot be aligned, it is grayed out and not assigned an exon number. This results in unstable exon numbers downstream, and perhaps gives unfamiliar numbers to well-known exons in certain genes assigned in the experimental literature. However, exon numbering is dynamic, as new 5' UTR exons are often found over time. Numbering exons from the start codon is vulnerable to alternative translation starts. With alternative splicing, there may not be a consistently dominant or naturally canonical form in all tissues to initiate numbering. Thus, there is no consensus on exon numbering at this time.
The information presented in the Exons track can be verified and adjusted by comparing it with the Gap track in the Genome Browser. If an unalignable piece commences at a gap but re-commences later after good genomic sequence, the Proteome Browser may treat it as an extension of the proximal exon but display it in gray to indicate uncertainty through the other cases. Also, if the mRNA coding has an insertion relative to the base genomic sequence, it is indicated by a gray bar in the Exon display.
It is advisable to place some sort of cutoff on mRNA-derived protein length. Proteins under 100 amino acids are often fragments, mispredictions, or simply artifacts. To set the cut-off objectively, the length distribution plot was sampled for hand-curation at the low end (5 putative proteins in each block-of-ten range, e.g., 30 - 40 amino acids) to examine the evidence. The quality increases monotonically with greater length; the cutoff was set at 80% or greater having meaningful other supporting documentation.
Exon count in mammals has an early peak that declines rapidly and monotonically to a very long tail reaching out to 363 exons (which code for 38,138 amino acids) in the human gene titin. The KIAA cDNA Human Unidentified Gene-Encoded database (HUGE) has somewhat corrected for a very significant experimental and annotation bias against long proteins.
Genes with a single coding exon appear in excess, but this is distorted by certain large gene families (olfactory receptors), gene fragments, and unrecognized processed pseudogenes. Human ribosomal proteins alone have over 2000 known pseudogenes). Discounting this, a single peak would occur at 4 exons (7.4% of all genes). There remains a substantial annotation bias toward fewer exons as prediction software tends to split genes possessing long introns -- the number of genes in the Ensembl human gene collection declined by nearly 7500 genes to 21,787 in progressing to NCBI assembly 34 (UCSC version hg16).