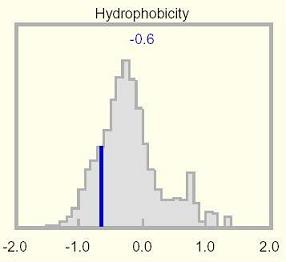
This histogram shows the mean hydrophobicity for the selected protein relative to a genome-wide distribution of all proteins in the UniProtKB database, which is essentially a broad Gaussian centered on zero. A few proteins fall outside the plotting display range and are not accounted for in this distribution. The mean hydrophobicity is shown at the top of the histogram, and is indicated by a dark blue vertical line overlying the genome-wide distribution.
To view the distribution of hydrophobic residues across the selected protein, see the Hydrophobicity track.
In conjunction with other tracks and specialized prediction tools, patterns of hydrophobic residues can sometimes be interpreted structurally. Smoothing the track over a rolling window size of 6 is effective in locating surface-exposed (polar) regions, whereas a window size of 20 is better suited for defining transmembrane domains that peak at a local average hydrophobicity score of 1.6 or more. Interior hydrophobic residues, while often packed tightly and critical to protein folding and stability, may be dispersed along the linear sequence. UniProtKB offers 22 other choices of hydrophobicity scales and considerable control over smoothing the convolutions.
Using the genome-wide amino acid composition of human proteins, the averaged amino acid has a hydrophobicity close to zero (-0.018). This reflects the design of the scale, the need for surface polar and charged residues to maintain solubility, and the frequencies of cytoplasmic and membrane-bound proteins. The track uses a baseline of zero.
The mean hydrophobicity of the selected protein illustrated in the Hydrophobicity histogram is not always informative, because transmembrane domains can be offset by highly polar regions elsewhere, yielding an overall mundane value. Unusual values may be apparent in the Hydrophobicity track, and will also surface as amino acid compositional anomalies.